

Measuring Board Fit — Evidence from Elliott’s Campaign at Norwegian Cruise Line
Boards are routinely assessed with tools that cannot answer the question that matters most: whether a given director’s accumulated professional experience fits the strategic needs of the specific company on whose board that director sits. This post describes a new method that uses contextualized word embeddings to measure such fit directly, and applies it to Elliott Investment Management’s 2026 campaign at Norwegian Cruise Line Holdings. The analysis finds that NCLH’s pre-campaign board was less aligned with its own strategic identity than the boards of its closest peers, that its directors were unusually similar to one another, and that the post-settlement board narrowed both gaps. With this method, directors and investors can build better boards.
On February 17, 2026, Elliott Investment Management launched a campaign against the Board of Norwegian Cruise Line Holdings (NCLH). Under the banner “Norwegian Now,” the prized investment fund, which had quietly amassed a stake exceeding 10% in the company, published a sweeping 59-page indictment of NCLH’s leadership, strategy, operations, and governance. The message was clear: The company had squandered a decade of industry tailwinds, and the board was largely to blame. Lacking necessary industry expertise, strategic alignment, and fresh perspective, Elliott outlined how NCLH’s directors had overseen the company’s stock underperform the market and its closest peers, with Royal Caribbean outpacing NCLH’s growth by roughly 400% over the last five years.
Not uncommon for Elliott, change was swift. By March 26, 2026, the two sides had reached a settlement that triggered the most dramatic boardroom reshuffle in the company’s history. The agreement led to the departure of the Board Chair and three other long-standing directors, clearing the way for five new directors, four of whom were part of the settlement.
The NCLH episode raises a question that every board, investor, and governance professional should be asking: How can anyone actually know whether a board has the right people for the job? Not whether directors are credentialed or experienced in the abstract, but whether their specific capabilities, perspectives, and professional identities genuinely fit the strategic needs of the specific company in this specific moment. As we have found, and explain below, existing tools leave decision-makers under-equipped to answer this question. But artificial intelligence (AI) is changing that.
The Skills Matrix Trap
A Skills Matrix is the go-to tool for assessing a board’s fit. Popularized by governance consultants and now expected by institutional investors, skills matrices catalog the competencies represented on a board—finance, technology, marketing, international experience, and so on. The logic seems right: If you can map the skills a company needs to the skills its directors possess, you can identify gaps and fill them. Exhibit 1 provides an example from NCLH’s 2025 proxy statement. The New York Stock Exchange’s listing standards nudge companies toward this form of disclosure. Proxy advisors like ISS and Glass Lewis scrutinize them.
In practice, skills matrices have become a checkbox exercise. They are self-reported (directors and their advisors decide which categories they belong in), static (they capture backgrounds, not evolving perspectives), and generic (often, most of the same dozen categories appear across industries as different as pharmaceuticals and cruise lines). A director who ran a logistics company twenty years ago might check the “Operations” skills box alongside a director who optimizes supply chains with modern machine learning techniques. The matrix treats them as interchangeable. Worse, skills matrices tell you nothing about how much a director’s professional identity actually aligns with the specific company.
The skills matrix is only the most visible symptom. Board self-evaluations rely on directors grading themselves. Search firm databases catalog titles and tenures. Proxy advisor screens check independence and attendance. None of these tools can answer the question that actually matters: how closely does this specific person’s accumulated professional identity align with this specific company’s strategic needs, right now?
Consider the NCLH board at the launch of Elliott’s campaign. Its eight members had backgrounds in industries as diverse as private equity, funeral services, gaming, fastcasual restaurants, consumer goods, and financial analysis. These experiences enabled them to check the boxes for “Operations or Strategy Oversight,” “Financial & Accounting,” “Sales, Marketing & Branding”, and “Risk Management.” But, as Elliott claimed, few of them had specific operations, financial, sales, and risk management skills relevant to a cruise line.
This is not an isolated case. In our research, we find that boards routinely assemble impressive-sounding credentials that obscure meaningful misalignment with their company’s strategic needs. The result is what we call the “fit gap”—the disparity between what a board looks like on paper and what it actually brings to the boardroom in the context of a specific firm’s strategy, industry, and competitive challenges.
The problem is structural. To begin with, board composition has historically been a relationship-driven process. Directors are recruited through personal networks, and many nominating committees rely heavily on who they know—or who their advisors know. Years of research show this can produce boards that are socially cohesive but cognitively homogeneous: directors who think alike, come from similar orbits, and reinforce each other’s assumptions.
There has also been no scalable, objective method for measuring the multidimensional alignment between a director’s full professional identity and the specific needs of a company and its board. You can verify whether someone has a finance background, but how do you systematically assess whether her capital allocation experience meshes with the company’s current strategic dilemmas? How do you evaluate whether a director’s professional identity brings genuinely new thinking to the boardroom, or merely replicates what is already there? This is where our AI-powered method can help.
AI-Enabled Board Fit Analysis
We have developed a methodology that uses AI to create rich, multidimensional profiles of directors and the companies they govern, and then to measure the degree of similarity or divergence between them.
The core technology we use is transformer-based, contextualized word embeddings, the approach that underpins modern large language models. As illustrated above, traditional board assessments categorize directors by industry (“retail”), function (“finance”), or skill (“digital transformation”). Word embeddings go further. Using AI to process large volumes of text—everything publicly available about a director, including biographical profiles, SEC filings, articles they’ve written, podcast appearances, press coverage, and speeches—we can capture in strings of numbers the full breadth and nuance of that director’s professional identity (for a detailed treatment of the methodology underlying large-scale organizational text collection and word-embedding analysis, see Haans & Mertens, 2026).
A traditional director skills matrix with 12 dimensions allows for 4,096 possible combinations of Yes or No assignments. That sounds like a lot until one considers the limitations noted above, and the fact that embeddings can capture directors’ professional identities across thousands of far more nuanced dimensions. With that degree of variation, two directors with identical skills matrices may have very different embeddings-based professional identities because one spent her career in luxury hospitality while the other built industrial supply chains. Where the matrix sees identical credentials, the embedding sees two entirely different professional identities. And unlike a checkbox, distance in this space is measurable, which is what allows fit to become a number rather than an impression.
Analogous profiles can also be built for companies, revealing their strategic identities. Using 10-K filings, annual reports, corporate websites, mission and purpose statements, press releases, earnings call transcripts, news articles, and a wealth of other unstructured text sources, we construct word embeddings that represent what a firm does, how it talks about itself, which capabilities it possesses or lacks, and what challenges it faces.
Once these detailed identities have been captured for directors and companies through word embeddings, their similarity to one another can be measured on a range from 0 (unrelated) to 1 (identical). In practice, the resulting similarity scores occupy a much narrower band, as any two concepts are at least somewhat related, yet not identical. What matters is how scores compare with one another, and even small absolute differences can translate into meaningful differences in relative rank. A low director–firm similarity score between a board member’s professional identity and the company’s strategic identity suggests that the director might bring an experience set that is relatively different from what the company might need, and a higher similarity score means that the board member’s skills and the company’s needs are closely aligned.
The approach also enables us to calculate similarity scores between individuals’ professional identities and the board’s collective professional identity. Here, a high director–board similarity score can often signal the potential for groupthink, as the directors are highly overlapping in their composition. Hence, a company looking for the kind of cognitive divergence that has been shown to drive breakthrough innovation might consider looking for people whose identities differ more from those of the rest of the group.
While not replacing human analysis, this approach can amplify it by giving new insights into the profiles of director candidates—and how they fit (or don’t) with specific companies, other directors, and their boards. In particular, it offers four features that conventional assessment tools do not. It is measured rather than self-reported: profiles are built from what directors have actually done and said, not boxes they ticked. It is relational rather than categorical: it scores fit against a specific company, board, and industry—no matrix can produce a number for how well a person fits. It is dynamic: identities update as new filings, coverage, and appearances accumulate, so fit can be tracked as individuals and strategy shift in real-time. And it is counterfactual: a board can simulate how a candidate would change its collective profile before extending an offer—a what-if analysis that conventional tools cannot support.
Putting It to the Test: Inside NCLH’s Board
To illustrate the approach, we applied it to NCLH’s pre- and post-campaign boards, as well as the boards of its three primary competitors—Royal Caribbean Group, Carnival Corporation, and Viking Holdings.
A note on construction. Each director’s profile is built from publicly available text associated with that individual—biographical disclosures in proxy statements, other SEC filings, interviews, published writing, and press coverage—collected as of the campaign’s announcement date. Firm profiles are built from the corresponding company’s most recent 10-K, annual report, investor communications, and earnings call transcripts. Both are embedded using the same transformer model, and every figure reported below is a cosine similarity between the resulting vectors. The director pool comprises the 45 individuals then serving on the boards of the four companies studied; all ranks are with respect to that
pool.
Consider the director–firm similarity scores for NCLH’s incumbent and new directors, ranging from 0.221 to 0.364 (Exhibits 2 and 3). Before Elliott’s intervention, Mary Landry, a former U.S. Coast Guard Rear Admiral, was the director comparatively most aligned with NCLH’s strategic identity (0.364). By contrast, all other cruise companies had at least one director scoring over 0.4, with Torstein Hagen taking the top spot (0.431)—a shipping and cruise veteran of nearly five decades and Viking’s founder. These results support Elliott’s concern regarding the NCLH board’s lack of relevant cruise industry expertise at the time of the campaign.
At the other end of the spectrum, board veteran David Abrams’ (0.228) and newcomer Linda Jojo’s (0.221) professional identities aligned the least with NCLH’s strategic identity, ranking 35th and 36th out of all 45 cruise industry directors. Abrams co-manages a private equity fund, and Jojo has technology and B2B experience at United Airlines. Both are relatively far removed from NCLH’s strategic identity.
Interestingly, Jojo’s director–board similarity (0.512; ranked 44th out of 45 cruise industry directors) is noticeably lower than Abrams’ (0.698; 17th out of 45), indicating that the diversity in professional identity she contributed was more additive to the pre-campaign board. Abrams’ perspectives were already covered by other directors to a greater degree. All other directors were clustered tightly together with director–board similarity scores above 0.7, suggesting a homogeneous core overall.
Following the campaign, four incumbent directors resigned. This included Landry and Abrams, who were both long-tenured, but, as noted above, resided at opposite ends of the NCLH board’s director–firm similarity spectrum.
Five new directors joined NCLH’s board, four of whom were appointed as part of the settlement with Elliott. Three out of these four additions exhibit director–firm similarity scores above the pre-campaign board’s average of 0.304, a sign of added expertise relevant to the company’s strategy. For instance, Jonathan Cohen adds a background in the energy sector, aligning with NCLH’s need to manage fuel as a core cost driver that is becoming increasingly critical due to geopolitical volatility. In contrast, Steve Pagliuca, who was not part of the settlement with Elliott but was appointed simultaneously, scores somewhat lower on director–firm similarity (0.260; 30th out of 45) and sits closer to the incumbent board’s existing profile on his director–board similarity (0.697; 18th out of 45).
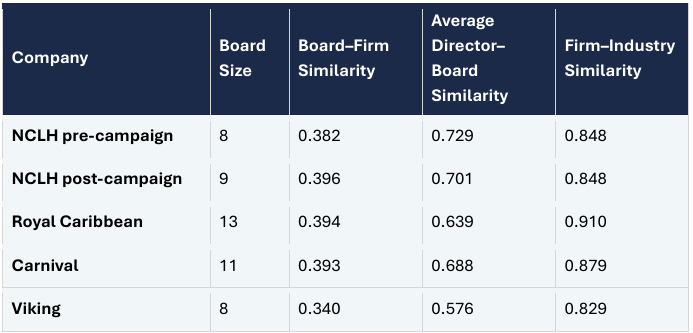
Next, we compared pre- and post-campaign NCLH to its peer group using board–firm similarity (Exhibit 4), which reflects the degree to which a board’s collective professional identity matches the strategic identity of the company it governs. Before the campaign, NCLH’s board had the second-lowest similarity to its firm (0.382) across the four cruise companies, ahead of only Viking (0.340) and below both Carnival (0.393) and Royal Caribbean (0.394). This echoes Elliott’s claim that NCLH lacked “directors… with executive experience in the cruise industry.” Following the campaign, this mismatch reversed, with NCLH’s board–firm similarity (0.396) now in line with Carnival’s and Royal Caribbean’s, consistent with the addition of directors whose profiles sit closer to the company’s
strategic identity.
Turning to the similarity among directors, Elliott’s appointees each brought professional identities more distinct from the incumbent core, nudging NCLH’s average director–board similarity down from 0.729 to 0.701. That the average moved only modestly is itself instructive—even the most dramatic board reshuffle in the company’s history could not fully unwind the accumulated homogeneity in a single cycle. NCLH’s directors remain more similar to one another than those of its peers, including Royal Caribbean (0.639), Carnival (0.688), and Viking (0.576).
The same embeddings that profile directors and boards can profile entire industries as well. Averaging the strategic identities of the four cruise companies yields the industry’s strategic center of gravity; a firm’s firm–industry similarity measures how closely its own strategic identity tracks that center. A high score means the company competes squarely within the industry’s dominant playbook, whereas a low score means it has staked out a differentiated position—deliberately or not. This matters for board fit because the two situations call for different boards: a differentiated strategy needs directors who understand the road less traveled, while a mainstream strategy rewards deep category expertise.
Viking has the lowest similarity to the cruise industry’s center of gravity (0.829), which is to be expected, given its strong focus on river cruises. NCLH has the second-lowest score (0.848), which could similarly reflect successful differentiation away from the category defining Royal Caribbean (0.910) and Carnival (0.879). However, it could also be the result of what Elliott painted as failed counter-positioning against several lucrative industry trends, such as NCLH’s smaller average hull size, while the industry moves toward ever larger ships. It remains to be seen if the newly reconstituted board will pivot to capitalize on these broader industry trends or double down on a differentiated strategy. Either way, the metrics reveal how well the board is positioned to chart the path forward.
In conclusion, applying our AI-enabled analysis to NCLH reveals that Elliott’s campaign has led to meaningful improvements in board fit—on several dimensions. By pushing for the addition of directors with comparatively higher director–firm similarity scores, the board was infused with relevant expertise and strategic alignment, bringing board-firm similarity in line with industry peers. Moreover, director–board similarity and the resulting threat of groupthink decreased.
Beyond the Contested Election
The NCLH case illustrates how AI-driven board analysis can be applied in a high-profile
activist campaign. But the applications extend far beyond contested elections.
-
For nominating committees, the analysis provides a diagnostic tool that can be
used proactively. Rather than waiting for an activist to publicly expose misaligned
directors and missing perspectives, boards can regularly assess their own
composition against the company’s evolving strategic identity. If a company is
pivoting toward digital transformation, the fit analysis can identify whether its
directors’ collective professional identity reflects that shift—or whether the board’s
profile still anchors it to the old strategy. Critically, the analysis can evaluate
potential director candidates before they are appointed, showing precisely how a
new member would change the board’s similarity profile and cognitive diversity. -
For institutional investors, the approach fills the gap created by the erosion of the
proxy advisory system. When JPMorgan announced its internal AI-based Proxy IQ
platform to replace ISS and Glass Lewis’s recommendations, it signaled that the
future of proxy voting lies in proprietary analytical capabilities. Our methodology
offers a rigorous, data-driven way for asset managers to independently evaluate
board composition, not through the blunt “for/against” voting advice of proxy
advisors, but through granular similarity assessments that reflect the specific
strategic context of each company. In a contested election, an investor could use
this analysis to determine whether an activist’s proposed directors would genuinely
improve the board or merely replace one set of misfit perspectives with another. -
For boards benchmarking against peers, the industry-level analysis provides a
useful lens. Consider a company whose board scores significantly higher on
average director–board similarity than its closest competitor, meaning its directors’
professional identities cluster more tightly together. If that same company has
consistently underperformed its peers over the same period, the pattern is worth
examining. While correlation is not causation, it is consistent with research that
finds boards with healthy cognitive divergence to be better positioned to generate
strategic innovation. The approach makes these comparisons systematic: rather
than relying on anecdote or intuition, companies can benchmark their board’s
cognitive similarity profile against peers and ask whether the composition of the
room might be constraining the quality of thinking inside it. -
For individual directors and the firms that place them, the method turns career
strategy into something that can be analyzed rather than intuited. A director can
identify which boards and companies her professional identity genuinely fits—
where she would add a distinct perspective rather than duplicate one already in the
room—and, for boards she already serves on, which dimensions of her profile to
develop to add more value as the company’s strategy evolves. Executive search and
board placement firms, such as Korn Ferry and Spencer Stuart, can use the same
analysis to match candidates to openings on measured fit rather than network
proximity, replacing the very relationship-driven dynamics that created the fit gap in
the first place.
These applications represent a fundamental shift in how corporate governance is practiced. For decades, board evaluation has relied on human judgment, relationship networks, and restrictive categorical tools. Our approach does not replace human judgment, as no algorithm can rightfully assess a director’s integrity, interpersonal skills, or willingness to challenge a CEO in a difficult moment. But it gives decision-makers a far richer information base to work with. It makes visible what has previously been invisible: the multidimensional alignment between the people in the boardroom and the company they are charged with governing.
***
As the dust settles on Elliott’s campaign at NCLH, the newly constituted board is getting to work. But the underlying question the campaign raised will persist. Every board in every industry faces some version of the fit gap. The companies and investors that adopt AI-enabled approaches to identify it will have a significant advantage over those that continue to rely on intuition, networks, and checkboxes. The boardroom is, at its core, a strategic decision-making group. It is time we evaluate it with the precision that distinction demands.
Exhibit 1: Director Skills Matrix for NCLH (2025)
A standard example of the traditional board skills matrix. While routinely used to satisfy proxy advisors and exchange listing standards, these static, self-reported grids reduce complex professional backgrounds to generic checkboxes. By treating broad categories as interchangeable, they often obscure the “fit gap”—the disconnect between a director’s paper credentials and their actual alignment with a company’s specific strategic needs. Source: NCLH 2025 Proxy Statement, capturing board composition prior to the May 2025 appointment of Linda Jojo and Harry Sommer’s February 2026 departure.
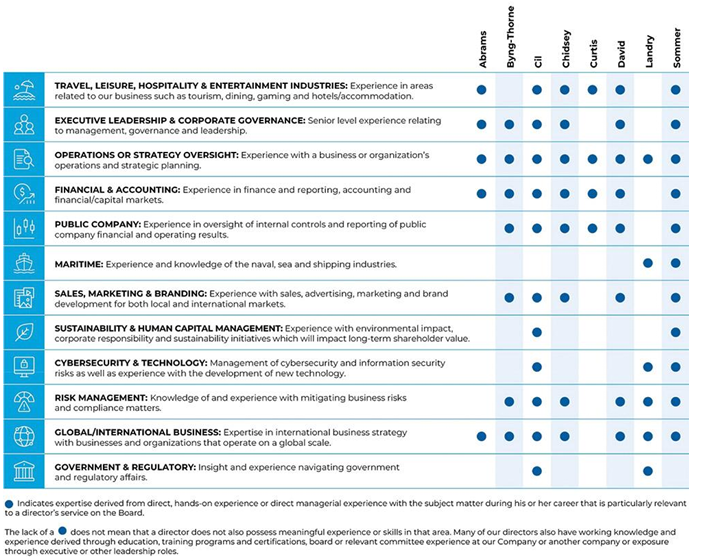
Exhibit 2: Pre- and Post-Campaign NCLH Board—Individual Director Similarity Scores
Directors are listed in descending order of board tenure. Similarity scores are cosine similarities (0-1 scale). Higher director–firm similarity = closer alignment between the director’s professional identity and NCLH’s strategic identity. Higher director–board similarity = closer alignment between the director’s professional identity and NCLH board’s collective professional identity. Similarity rank is with respect to the pool of 45 cruise industry directors. All data were generated using the word-embedding-based methodology described in this article. For expositional clarity, retained directors’ director–board similarity scores are provided in the table only with respect to the pre campaign board, though we also re-estimated them with respect to the post-campaign board: Byng-Thorne (0.711), Cil (0.735), Chidsey (0.756), and Jojo (0.570).
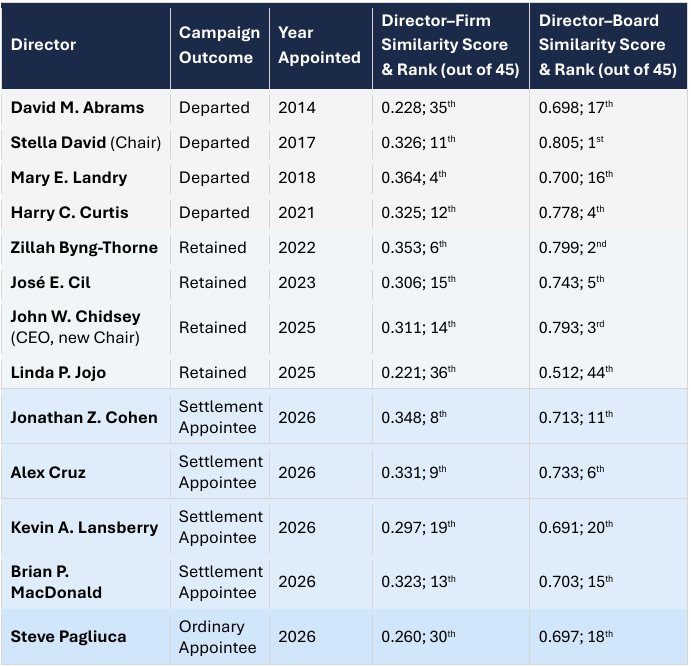
Exhibit 3: NCLH’s Directors in Context—Individual Similarity Scores Against the Full
Cruise-Industry Director Pool
Positioning NCLH’s directors within the full distribution of cruise industry directors. Vertical reference lines mark the pool’s quartiles and median. Director-firm similarity spans from 0.138 to 0.431, and director-board similarity spans from 0.472 to 0.805. All data were generated using the word-embedding-based methodology described in this article.
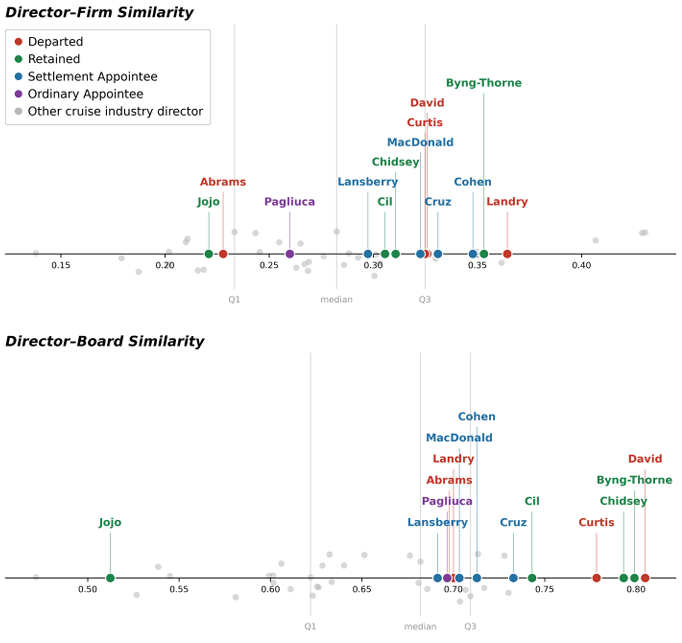
Exhibit 4: Similarity Metric Comparison Across Cruise Industry
Similarity scores are cosine similarities (0–1 scale). Higher board–firm similarity = closer alignment between the board’s collective professional identity and the company’s strategic identity. Higher average director–board similarity = closer alignment in professional identities among directors. Higher firm–industry similarity = closer alignment between the firm’s strategic identity and the cruise industry’s dominant strategic paradigm. All data were generated using the word-embedding based methodology described in this article.
Legal Disclaimer:
EIN Presswire provides this news content "as is" without warranty of any kind. We do not accept any responsibility or liability for the accuracy, content, images, videos, licenses, completeness, legality, or reliability of the information contained in this article. If you have any complaints or copyright issues related to this article, kindly contact the author above.
